Week 11
Computer Programming

Goal
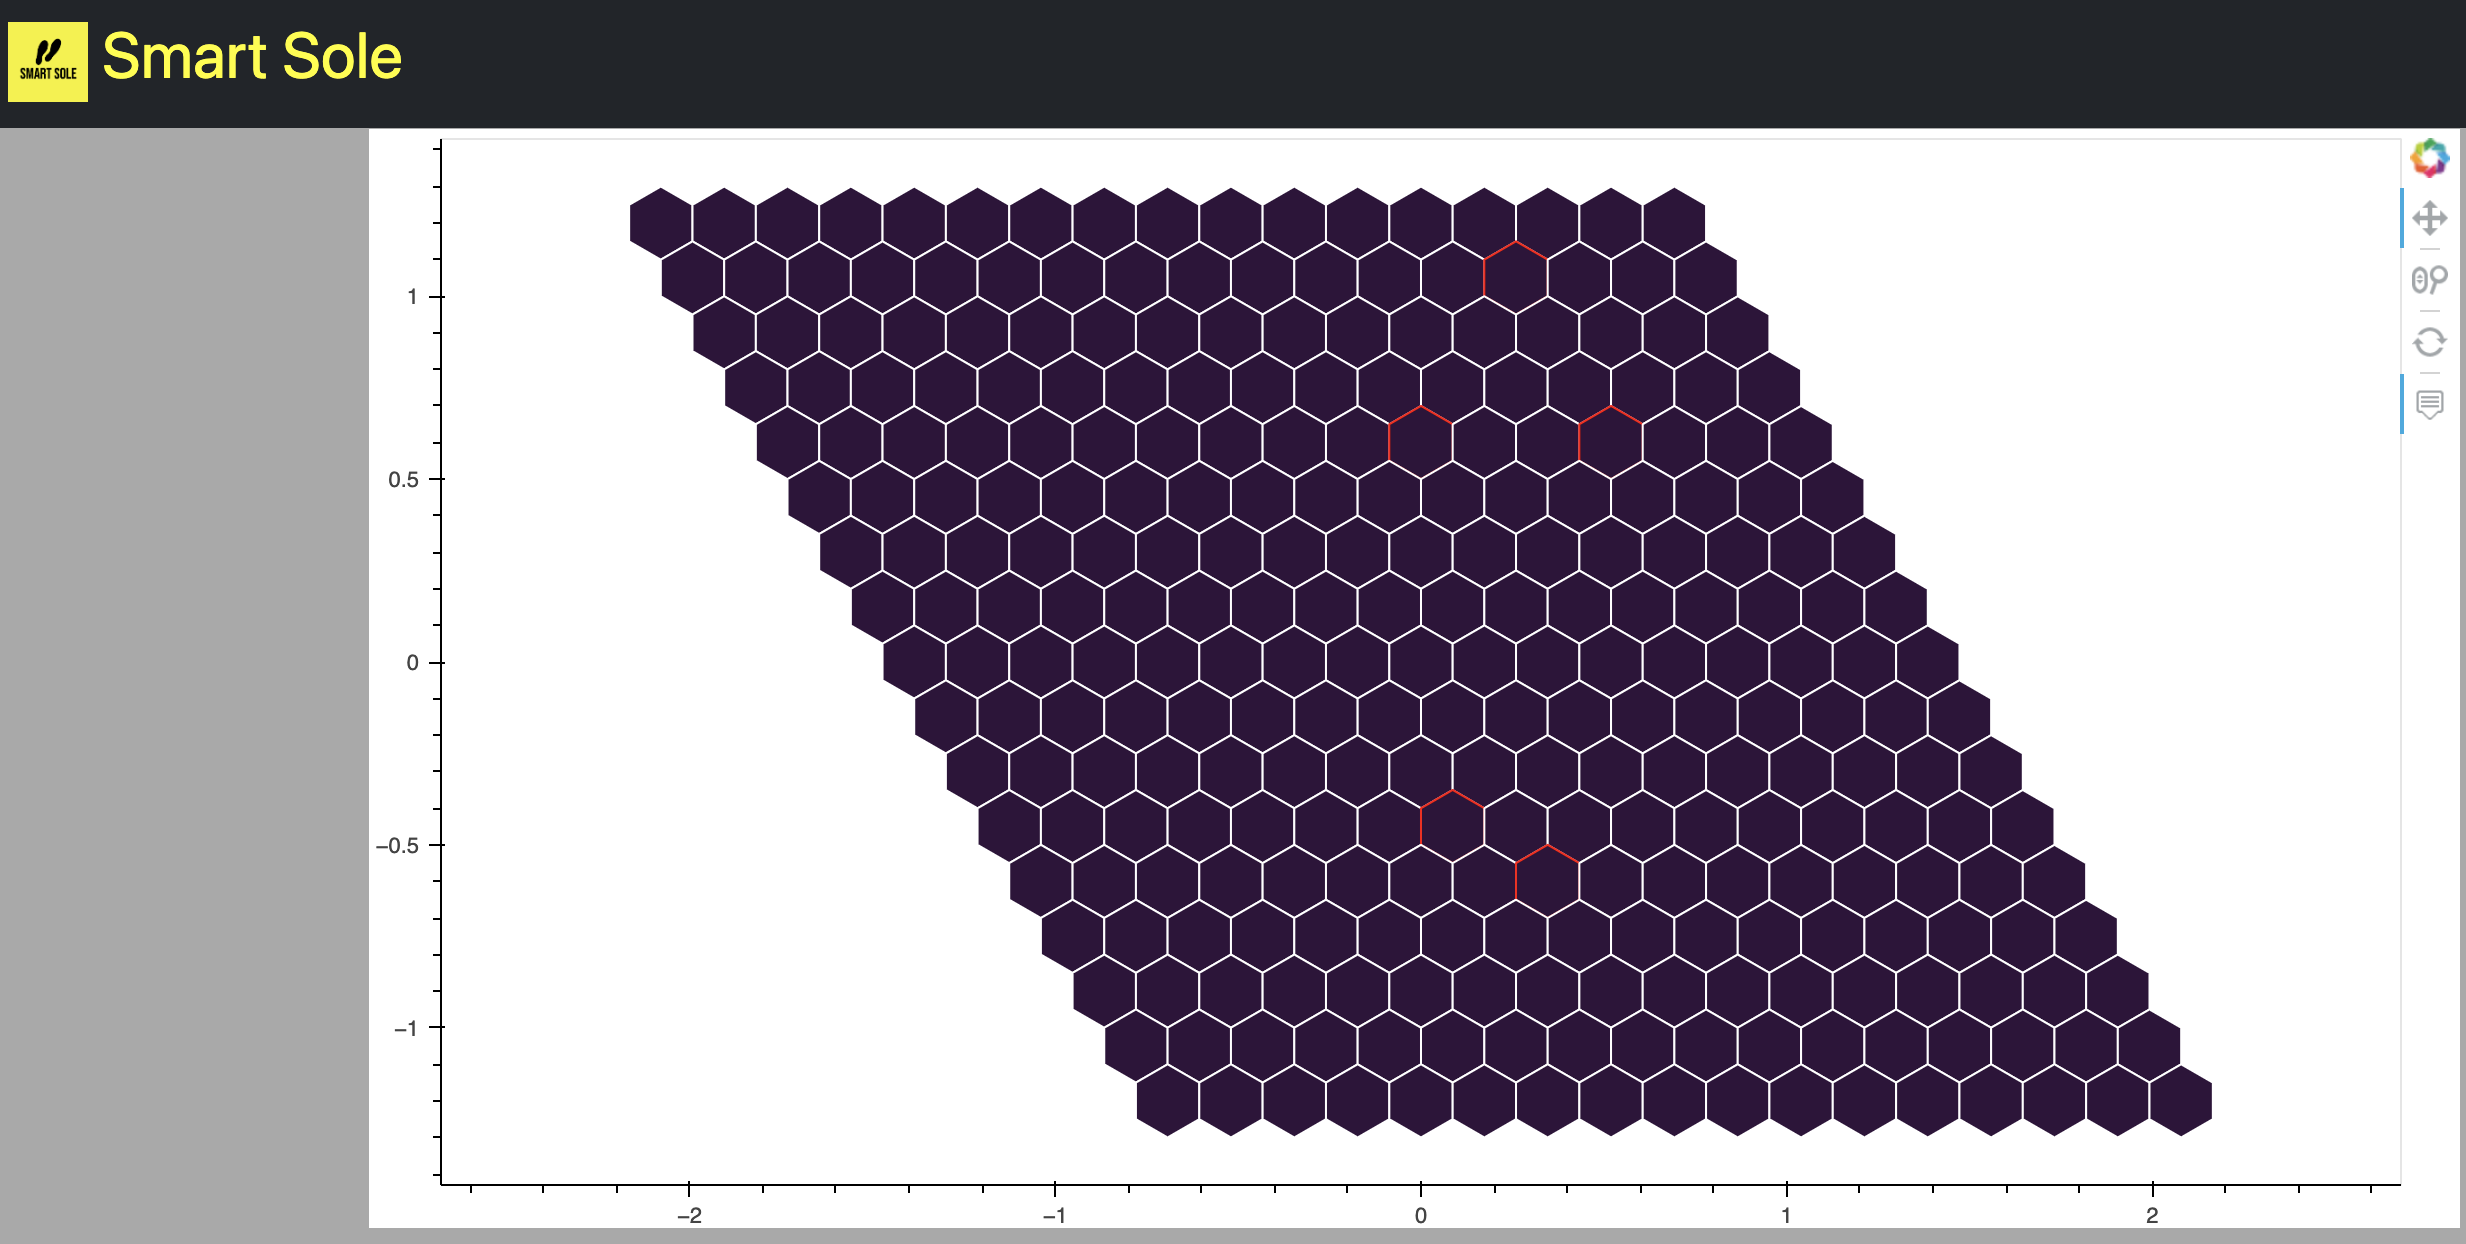
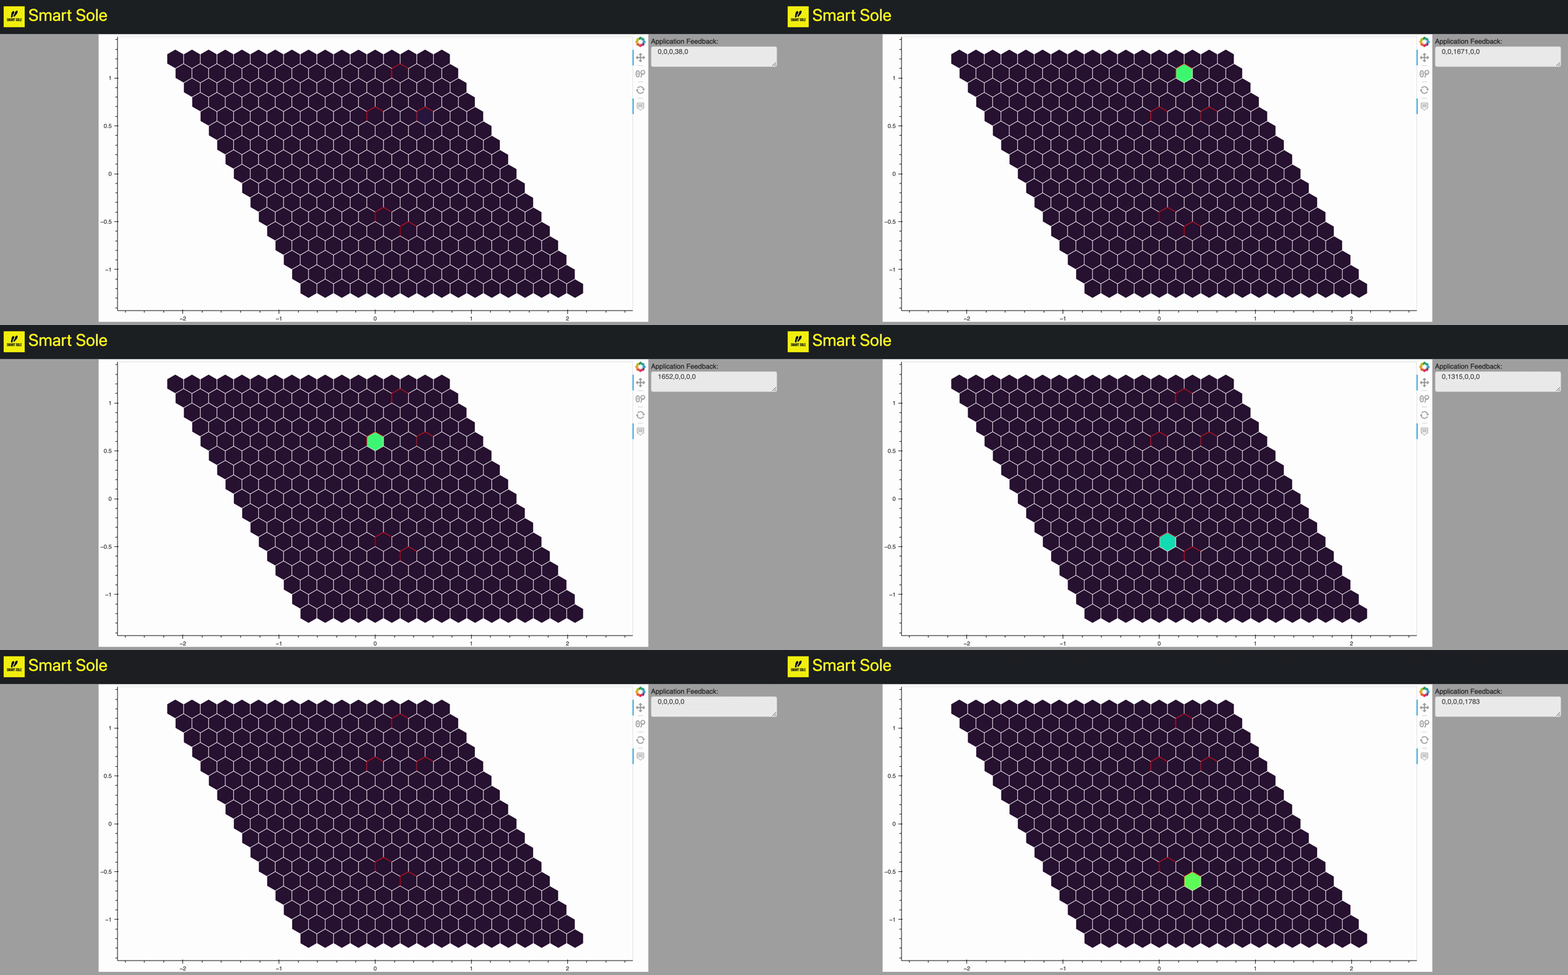
My goal for this week was to effectively create a live web app to visualize data retrieved from a Google Firebase database. In particular, given that I am working with FSRs in my final project, I wanted to visualize the intensity of the force felt by each of the sensors in an interface.
Approach
In order to visualize the data, I used python graphics modules (Bokeh and Pandas to be specific). These are really simple packages that allow one to create a contour map of sorts and map values to a color range. The main component of my python code is at the bottom of the page. I essentially read the data as a string of numbers to indicate the color of hexagons I specified on an array, corresponding to the location of the FSRs on the Smart Sole. To incorporate it into a web app, I used a simple html and css format (Files in Zip on final project page.

For the Demo above, I worked my way clockwise around the FSRs on the Smart Sole to show how they update live on the visualizer. I also included a printout of the actual analog quanities observed to the right of the visualizer.
File Download Link
User Interface Python App Startup: application.pyMain Python Code:
          import builtins
          from turtle import widthpo
          import pandas as pd
          import time
          from bokeh.io import curdoc
          from bokeh.layouts import column, row
          from bokeh.models import ColumnDataSource, TextInput, Select, Legend, Button, Div, Toggle, HoverTool, TextAreaInput
          from bokeh.plotting import figure
          from bokeh.palettes import Turbo256
          import numpy as np
          from bokeh.transform import linear_cmap
          from bokeh.util.hex import hexbin
          import colorcet as c
          import serial
          import firebase_admin
          from firebase_admin import db

          # 33, 32, 39, 36, 34

          # firebase url: https://console.firebase.google.com/u/0/project/esp32-firebase-final-project/database/esp32-firebase-final-project-default-rtdb/data/~2F

          # log into firebase
          credentials = firebase_admin.credentials.Certificate("esp32-firebase-final-project-firebase-adminsdk-4yvxl-c81ea8a118.json")
          config_dict = {
              'databaseURL':'https://esp32-firebase-final-project-default-rtdb.firebaseio.com/'
          }
          try:
              app = firebase_admin.initialize_app(credentials, config_dict)
          except:
              app = firebase_admin.get_app()
          ref = db.reference("")

          # create serial object
          # arduino = serial.Serial("COM5")
          # arduino.baudrate = 9600

          # create dataframe representing hexagon locations
          n = 8
          g = np.linspace(-n, n, 2 * n + 1)

          # sensor_locs = [
          #     (5, -8),
          #     (2, -4), (6, -4),
          #     (0, 0), (4, 0),
          #     (-2, 4), (2, 4),
          #     (-2, 8)
          # ]

          # sensor_locs = [
          #     (5, -7),
          #     (2, -4), (5, -4),
          #     (-1, 3), (0, 4)
          # ]

          sensor_locs = [(2, -4), (-1, 3), (5, -7), (5, -4), (0,4)]


          sensor_indeces = []

          xx, yy = np.meshgrid(g, g)

          hex_dict = {
              'q':xx.flatten(),
              'r':yy.flatten(),
              'counts':np.zeros(len(xx.flatten()))
          }

          bins = pd.DataFrame(hex_dict)

          bins['outline'] = "white"
          bins['index'] = bins.index

          for xy in sensor_locs:
              x = xy[0]
              y = xy[1]
              bins.loc[(bins['q']==x) & (bins['r']==y), 'outline'] = "red"
              sensor_indeces.append(int(bins.loc[(bins['q']==x) & (bins['r']==y), 'counts'].index[0]))

          # create datasource tracking sensor values
          source = ColumnDataSource(bins)

          # configure plot layout
          p = figure(tools="wheel_zoom,pan,reset", match_aspect=True, background_fill_color='white', plot_width=600, plot_height=550, sizing_mode="stretch_both")
          p.grid.visible = False

          p.hex_tile(q="q", r="r", size=0.1, line_color='outline', source=source,
                     fill_color=linear_cmap('counts', Turbo256, low=0, high=2**12 - 1)) # made max of scale 1023 because that is max level for 8 bits
          hover = HoverTool(tooltips=[("count", "@counts"), ("(q,r)", "(@q, @r)"), ("index", "@index")])
          p.add_tools(hover)

          # create feedback block
          feedback = TextAreaInput(value="", title="Application Feedback:", css_classes=['state_feedback'], disabled=True, sizing_mode='stretch_width')
          right = column(feedback, width=250, sizing_mode="fixed")

          #update data from firebase database
          def update():
              # update data in sensors
              data_ls = [int(x) for x in ref.get()['p_values'].split(",")]

              source.patch({
                  'counts':[(idx_pressure[0], idx_pressure[1]) for idx_pressure in zip(sensor_indeces, data_ls)]
              })

              # provide feedback if applicable
              feedback.value = ref.get()['p_values']

              return

          curdoc().add_periodic_callback(update, 500)
          curdoc().add_root(row(p, right, sizing_mode='stretch_both'))
